Shared KPI definitions
Revenue, activation, conversion and operational metrics have explicit rules instead of department-specific mythology.
Analytics systems that connect business questions to trustworthy data: event design, pipelines, KPI definitions, dashboards and reporting workflows people can use without a weekly export ritual.
Build what's next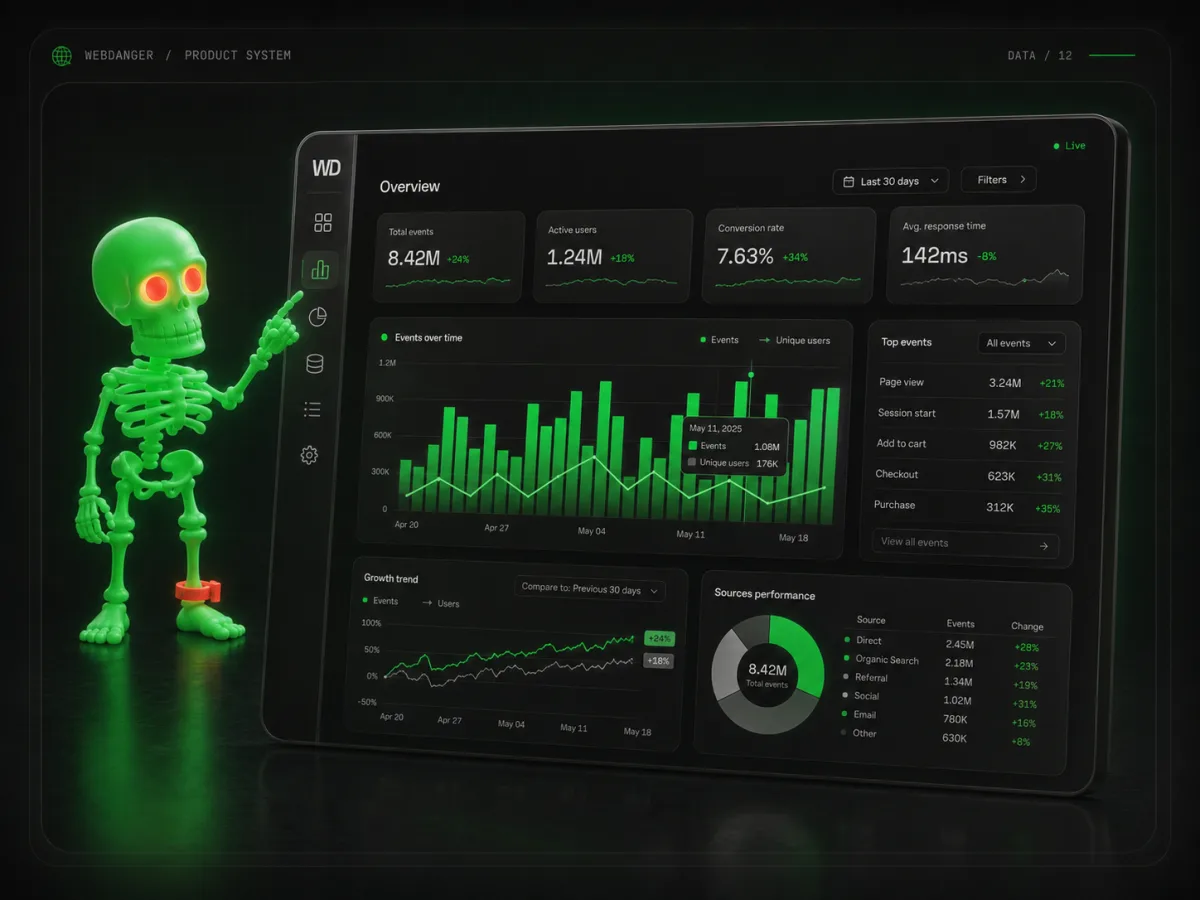
We align metrics with sources, ownership and refresh logic before choosing colours. Otherwise the dashboard simply makes inconsistent data look more confident.
Revenue, activation, conversion and operational metrics have explicit rules instead of department-specific mythology.
Sources, transformations and refresh schedules are visible enough to debug when the number looks wrong.
Dashboards focus on questions and exceptions so teams spend less time presenting and more time acting.
We start with what the team needs to know or change, then derive the metrics needed to support that decision.
Events, sources and transformations are structured around consistent definitions and quality checks.
Dashboards are designed for daily use, exception handling and drill-down—not screenshot collection.
If two reports disagree, adding a third dashboard is rarely the cure.
Yes. We can unify data from existing analytics, CRM, commerce and operational systems when APIs and access permit.
Yes, when a custom view creates real operational value. Otherwise we may recommend using a mature BI tool rather than rebuilding filters for sport.
Tell us what is stuck, expensive, slow or strategically important. We will turn the rough version into a concrete delivery path—with scope, ownership and the next decision visible.
hello@webdanger.com